NUE has met or exceeded earnings expectations in
the majority of
recent quarters (7/10)
Attractive Price-to-Earnings Ratio
Low Price-to-Sales Ratio
Strong Return on Equity
Healthy Operating Profit Margin
Strong Liquidity Ratios
Low Debt Levels
🏭 Strong Safety Culture
💰 Solid Financial Performance
🔧 Diverse Product Portfolio
🚀 Growth Initiatives
🌱 Strong Demand Outlook
High Price-to-Free Cash Flow Ratio
Low Net Profit Margin
Moderate Cash Position
📉 Margin Pressure
⚖️ Trade Challenges
Nucor demonstrates strong business quality through its safety culture, solid financial performance, and diverse product portfolio. However, it faces challenges from margin pressures and trade issues. Looking ahead, the company has promising growth prospects with significant investments and an optimistic demand outlook, despite concerns regarding trade dynamics.
Analysis Date: January 28, 2025 Last Updated: April 12, 2025
+137%
+9.0% per year
Past performance does not guarantee future results. The data presented is indicative and may not be updated in real-time.
CountryUS
ExchangeNYSE
IndustrySteel
SectorBasic Materials
Market Cap$28.32B
CEOMr. Leon J. Topalian
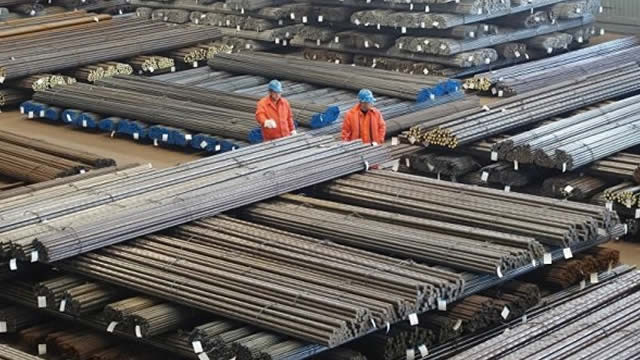
Nucor Corporation is a company that makes steel and steel products. They produce many different types of steel, which are used in buildings, cars, and other structures. Nucor sells their steel to various businesses in the United States, Canada, and Mexico, helping to build things like roads, bridges, and homes. They also recycle metal and produce raw materials for making steel, contributing to a more sustainable industry.
Streams of revenue
Sheet:32%
Bar:19%
Steel Products:13%
Structural:8%
Raw Materials:7%
Rebar Fabrication:7%
Plate:7%
Tubular Products:4%
Deck:4%
Geographic Distribution
All Other:100%
Core Products
🔩
Steel BarsReinforcement bars
🏗️
Steel BeamsStructural beams
🛡️
Steel PlatesThick steel plates
📄
Steel SheetsFlat steel sheets
🛢️
Steel TubingHollow steel tubes
Business Type
Business to Business
Competitive Advantages
💰
Cost LeadershipNucor's efficient production processes and economies of scale enable it to maintain lower costs compared to competitors.
🏗️
Vertical IntegrationBy controlling its supply chain through raw materials production and steel manufacturing, Nucor ensures quality and cost control.
⚙️
Innovative TechnologyInvestment in advanced technologies, such as electric arc furnaces, improves production efficiency and product quality, giving Nucor a competitive edge.
🌱
Sustainable PracticesNucor's commitment to sustainable steel production, particularly through recycling scrap metal, enhances its brand reputation and meets increasing regulatory standards.
🤝
Strong Customer RelationshipsNucor's focus on customer service and tailored solutions fosters loyalty and long-term partnerships within various industries.
Key Business Risks
🏭
CompetitionIntense competition in the steel industry can lead to price wars and reduced market share.
⚠️
Market VolatilityFluctuations in steel prices and demand can significantly impact revenue and profitability.
📜
Regulatory ChangesChanges in environmental regulations and trade policies can increase costs and operational complexity.
💻
Technological ChangesFailure to adopt new technologies may result in inefficiencies and loss of competitive advantage.
🔗
Supply Chain DisruptionsDependence on raw materials and logistics increases vulnerability to disruptions and delays.
Trailing Twelve Months (TTM) values provide a view of the company's performance over the last year.
Graham Value Metrics
Benjamin Graham's value investing approach focuses on finding stocks with a significant margin of safety between their intrinsic value and market price.
Intrinsic Value
Estimated fair value based on Graham's formula
$333.50
Current Market Price: $101.25
IV/P Ratio: 3.29x (>1.0 indicates undervalued)
Margin of Safety
Gap between intrinsic value and market price
70.0%
Graham recommended a minimum of 20-30% margin of safety
Higher values indicate a greater potential discount to fair value
Graham Criteria Checklist
Benjamin Graham's value investing checklist for NUE
Positive earnings (5+ years)
Dividend history (5+ years)
P/E ratio ≤ 20 (11.92)
P/B ratio ≤ 1.5 (1.19)
Current ratio ≥ 2.0 (2.51x)
Long-term debt < Net current assets (0.76x)
Margin of safety (70.0%)
NUE meets all Graham criteria
ROE: 9.865500011097037
ROA: None
Gross Profit Margin: 13.388850902156427
Net Profit Margin: 6.595108447647369
Trailing Twelve Months (TTM) values provide a view of the company's performance over the last year.
Income Statement Flow
Scroll horizontally to see more
About Profitability Metrics
Profitability metrics measure a company's ability to generate earnings relative to its revenue, operating costs, and other relevant metrics. Higher values generally indicate better performance.
Return on Equity (ROE)
Measures how efficiently a company uses its equity to generate profits
9.87%
10%15%
Higher values indicate better returns for shareholders
TTM (as of 2025-04-25)
Gross Profit Margin
Percentage of revenue retained after accounting for cost of goods sold
13.39%
20%40%
Higher values indicate better efficiency in production
TTM (as of 2025-04-25)
Net Profit Margin
Percentage of revenue retained after accounting for all expenses
NUE's return on equity (ROE) of 9.87% demonstrates effective use of equity financing to generate profits, which is a positive indicator of management performance.
Healthy Operating Profit Margin
9.69%
Operating Profit Margin
The operating profit margin of 9.69% indicates that NUE is able to maintain a good level of profitability from its operations, which is a positive sign for sustainability.
Weaknesses
Low Net Profit Margin
6.60%
Net Profit Margin
A net profit margin of 6.60% indicates that while NUE is profitable, it may not be as efficient in converting revenue into actual profit compared to industry peers.
About Financial Health Metrics
Financial health metrics assess a company's ability to meet its financial obligations and its overall financial stability.
Debt to Equity Ratio
Total debt divided by total equity
0.32x
1.0x2.0x
Lower values indicate less financial leverage and risk
Less than 1.0 is conservative, 1.0-2.0 is moderate, >2.0 indicates high risk
Less than 1.0 is concerning, 1.0-2.0 is adequate, greater than 2.0 is good
Q4 2024
Financial Health Analysis
Strengths
Strong Liquidity Ratios
2.51
Current Ratio
1.48
Quick Ratio
The current ratio of 2.51 and quick ratio of 1.48 indicate that NUE has a strong liquidity position, allowing it to cover short-term liabilities without financial strain.
Low Debt Levels
0.34
Debt-to-Equity Ratio
With a debt-to-equity ratio of 0.34, NUE maintains a conservative capital structure, reducing financial risk and enhancing stability.
Weaknesses
Moderate Cash Position
0.71
Cash Ratio
The cash ratio of 0.71 indicates that while NUE has sufficient cash to meet some obligations, it may not have enough liquidity to cover all short-term liabilities in a crisis.
Historical Earnings Results
Meeting Expectations
7/10
Higher values indicate better execution and credibility
Recent Results
2025-01-27
+29.8%
2024-10-21
-0.7%
2024-07-22
+14.0%
2024-04-22
-5.5%
2024-01-29
+9.0%
2023-10-23
+7.5%
2023-07-24
+5.1%
2023-04-20
+16.8%
2023-01-26
+16.7%
2022-10-20
-3.4%
Earnings call from January 28, 2025
EPS
0.94
Estimated
1.22
Actual
+29.79%
Difference
Strengths
🏭 Strong Safety Culture
Lowest in history
Recordable Injuries
Nucor highlighted its commitment to safety, achieving the safest year in its history with the fewest recordable injuries. This focus on safety is seen as integral to operational success and employee wellbeing.
💰 Solid Financial Performance
$8.46
Annual EPS
$4.4 billion
EBITDA
$2.7 billion
Shareholder Returns
Nucor generated $1.22 per share in the fourth quarter and $8.46 for the full year, with EBITDA nearly reaching $4.4 billion. The company also returned over $2.7 billion to shareholders through dividends and share repurchases.
🔧 Diverse Product Portfolio
$3.2 billion
CapEx for Growth
Nucor's strategy includes investing in high-margin, value-added products and expanding into steel-adjacent businesses, positioning the company well in various markets such as automotive and construction.
Weaknesses
📉 Margin Pressure
45%
Pre-tax Earnings Decline
Despite strong operational performance, the steel mill segment saw a 45% decrease in pre-tax earnings due to declining pricing and metal margins, highlighting vulnerability to market fluctuations.
Opportunities
🚀 Growth Initiatives
40% of construction completed
West Virginia Sheet Mill Progress
Nucor is actively investing in significant growth initiatives, including a new sheet mill in West Virginia, which is expected to begin operations by the end of 2026 and target advanced automotive and construction markets.
🌱 Strong Demand Outlook
Modest in 2025
Expected Demand Growth
The management anticipates modest growth in steel demand in 2025, driven by infrastructure and institutional construction, potentially benefiting Nucor's diversified product offerings.
Risks
⚖️ Trade Challenges
Negative on pricing
Impact from Imports
Nucor continues to face challenges from unfairly traded imports, which could impact domestic pricing and profitability, necessitating ongoing advocacy for trade protections.
We use cookies to analyze site traffic and optimize your site experience.
By accepting, you consent to our use of cookies. Read our Privacy Policy to Learn more.