Past performance does not guarantee future results. The data presented is indicative and may not be updated in real-time.
CountryUS
ExchangeNYSE
IndustryOil & Gas Refining & Marketing
SectorEnergy
Market Cap$38.66B
CEOMr. R. Lane Riggs
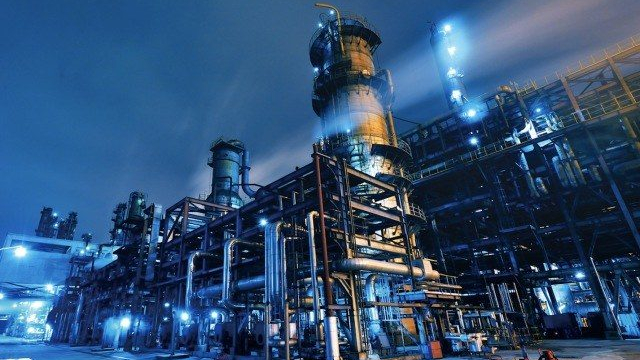
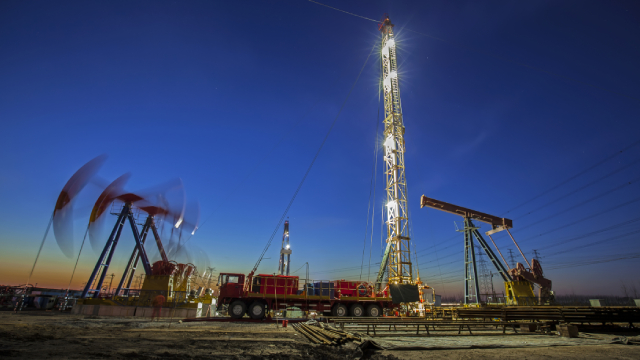
Valero Energy Corporation is a company that makes and sells fuels and other products made from oil. They operate refineries that turn crude oil into gasoline, diesel, and jet fuel, which we use to power cars, trucks, and airplanes. Valero also produces renewable diesel from things like used cooking oils and runs ethanol plants that create a type of fuel from corn. They sell their products through many gas stations and other outlets, helping to keep vehicles running across the United States and beyond.
Streams of revenue
Refining:93%
Renewable Diesel:4%
Ethanol:3%
Geographic Distribution
United States:70%
Europe:11%
Canada:9%
Latin America:6%
Asia:4%
Estimations for reference only
Core Products
🛣️
AsphaltRoad construction
🌽
EthanolRenewable fuel
🧪
PetrochemicalsChemical products
⛽
Refined Petroleum ProductsGasoline, diesel, etc.
Business Type
Business to Business
Competitive Advantages
⭐
Brand RecognitionWith established brands like Valero and Texaco, the company benefits from strong market recognition, fostering customer loyalty.
📈
Economies of ScaleValero's large refining capacity of 3.2 million barrels per day allows it to operate at lower costs, benefiting from economies of scale.
🔗
Integrated Supply ChainValero's ownership of logistics assets, including pipelines and marine docks, enhances its operational efficiency and reduces transportation costs.
🛢️
Diverse Product PortfolioThe company produces a wide range of fuels and petrochemical products, enabling it to cater to various market segments and reduce dependency on a single product.
🌱
Renewable Energy CommitmentValero's investment in renewable diesel and ethanol production positions it favorably in the evolving energy landscape, aligning with sustainability trends.
Key Business Risks
📉
Price VolatilityFluctuations in crude oil and natural gas prices can significantly impact profitability and operational stability.
🏁
Market CompetitionIntense competition in the refining and renewable energy sectors can pressure margins and market share.
⚖️
Regulatory ComplianceChanges in environmental laws and regulations can lead to increased compliance costs and operational restrictions.
💻
Technological ChangesRapid advancements in energy technologies may require significant investment to remain competitive and relevant.
🔗
Supply Chain DisruptionsDisruptions in the supply of crude oil or other raw materials can hinder production capabilities and affect revenue.
Meeting Expectations
10/10
Higher values indicate better execution and credibility
Recent Results
2025-01-30
2024-10-24
2024-07-25
2024-04-25
2024-01-25
2023-10-26
2023-07-27
2023-04-27
2023-01-26
2022-10-25
Takeaways
Valero Energy Corporation demonstrates a robust business model with diversified operations in refining and renewable energy, strong market positioning, and solid financial health. However, it faces significant risks from market volatility and regulatory changes in the energy sector.
Historical data shows an impressive CAGR compared with the USA stock market average, reflecting a strong market position.
10Y annualized return is
positive but below market average
at 6.9% per year
VLO has met or exceeded earnings expectations in
all
recent quarters (10/10)
Overall, Valero demonstrates strong operational quality and a commitment to shareholder returns, but faces challenges from declining earnings and market volatility. Future prospects appear promising with strategic investments and favorable market conditions, although external uncertainties remain a concern.
Analysis Date: January 30, 2025 Last Updated: March 12, 2025
Trailing Twelve Months (TTM) values provide a view of the company's performance over the last year.
Graham Value Metrics
Benjamin Graham's value investing approach focuses on finding stocks with a significant margin of safety between their intrinsic value and market price.
Intrinsic Value
Estimated fair value based on Graham's formula
$331.20
Current Market Price: $102.24
IV/P Ratio: 3.24x (>1.0 indicates undervalued)
Margin of Safety
Gap between intrinsic value and market price
69.0%
Graham recommended a minimum of 20-30% margin of safety
Higher values indicate a greater potential discount to fair value
Graham Criteria Checklist
Benjamin Graham's value investing checklist for VLO
Positive earnings (5+ years)
Dividend history (5+ years)
P/E ratio ≤ 20 (12.17)
P/B ratio ≤ 1.5 (1.38)
Current ratio ≥ 2.0 (1.53x)
Long-term debt < Net current assets (1.26x)
Margin of safety (69.0%)
VLO does not meet all Graham criteria
ROE: 10.941588900409815
ROA: None
Gross Profit Margin: 3.5536553424235424
Net Profit Margin: 2.1338879901394345
Trailing Twelve Months (TTM) values provide a view of the company's performance over the last year.
Profitability & Past Results
Strengths
Strong Return on Equity
10.94
Return on Equity
Return on equity (ROE) at 10.94% indicates efficient use of shareholder equity to generate profits, which is a positive indicator of profitability.
Healthy Net Profit Margin
2.13
Net Profit Margin
With a net profit margin of 2.13%, VLO demonstrates a reasonable capability to convert revenues into actual profit, which reflects good operational efficiency.
Weaknesses
Low Gross Profit Margin
3.55
Gross Profit Margin
The gross profit margin of 3.55% is quite low, suggesting that there might be challenges in managing production costs relative to sales.
About Profitability Metrics
Profitability metrics measure a company's ability to generate earnings relative to its revenue, operating costs, and other relevant metrics. Higher values generally indicate better performance.
Return on Equity (ROE)
Measures how efficiently a company uses its equity to generate profits
10.94%
10%15%
Higher values indicate better returns for shareholders
TTM (as of 2025-04-22)
Gross Profit Margin
Percentage of revenue retained after accounting for cost of goods sold
3.55%
20%40%
Higher values indicate better efficiency in production
TTM (as of 2025-04-22)
Net Profit Margin
Percentage of revenue retained after accounting for all expenses
Current ratio at 1.53 and quick ratio at 1.03 indicate VLO has sufficient liquidity to cover short-term obligations, reflecting good financial health.
Low Debt Levels
0.47
Debt to Equity Ratio
0.19
Debt to Assets Ratio
With a debt-to-equity ratio of 0.47 and debt-to-assets ratio of 0.19, VLO maintains a conservative leverage structure, reducing financial risk.
Weaknesses
Moderate Interest Coverage
6.53
Interest Coverage Ratio
An interest coverage ratio of 6.53, while adequate, could indicate a need for closer monitoring of earnings relative to interest obligations, especially in a volatile market.
About Financial Health Metrics
Financial health metrics assess a company's ability to meet its financial obligations and its overall financial stability.
Debt to Equity Ratio
Total debt divided by total equity
0.42x
1.0x2.0x
Lower values indicate less financial leverage and risk
Less than 1.0 is conservative, 1.0-2.0 is moderate, >2.0 indicates high risk
Less than 1.0 is concerning, 1.0-2.0 is adequate, greater than 2.0 is good
Q4 2024
Earnings call from January 30, 2025
Business Quality
Strengths
🏭 Operational Excellence
Best year for personnel and process safety in 2024
Safety Performance
Valero achieved record personnel and process safety, showcasing its commitment to safety and reliability. This operational excellence supports overall performance and enhances its reputation in the industry.
🔄 Refining Flexibility
Record volume in Q4 2024
Heavy Sour Crude Processed
The ability to process a record volume of heavy sour crude demonstrates Valero's refining flexibility and operational capabilities. This flexibility allows the company to adapt to market conditions and optimize margins effectively.
💰 Strong Shareholder Returns
78% for 2024
Payout Ratio
$4.3 billion in 2024
Total Return to Shareholders
Valero has maintained a robust payout ratio of 78% for the year, indicating strong financial health and a commitment to returning value to shareholders through dividends and share buybacks.
Weaknesses
📉 Earnings Decline
$281 million
Net Income Q4 2024
$1.2 billion
Net Income Q4 2023
Net income attributable to Valero stockholders decreased significantly from the previous year, indicating vulnerability to market conditions and lower refining margins.
⚖️ Margin Pressure
$437 million
Refining Segment Operating Income Q4 2024
$1.6 billion
Refining Segment Operating Income Q4 2023
The refining segment experienced a decline in operating income due to weak margins, which raises concerns about the sustainability of profits in challenging market conditions.
Future Prospects
Opportunities
🚀 Growth through Innovation
Fully operational as of Q4 2024
DGD Project Status
Valero is actively pursuing organic investments, such as the DGD Sustainable Aviation Fuel project, which is fully operational and aims to expand its earnings capacity through innovative products.
📈 Optimizing Production
$230 million
Project Cost
2026
Expected Start-up
The FCC Unit Optimization project at St. Charles is expected to enhance the yield of high-value products, indicating Valero's focus on improving operational efficiency and profitability.
🔮 Favorable Market Dynamics
1% year-over-year
Expected Increase in Diesel Demand
Long-term refining fundamentals are expected to remain strong, supported by low light product inventories and limited capacity additions, which could bolster refining margins.
Risks
⚠️ Uncertain Market Conditions
The company faces potential volatility due to external factors such as tariffs and geopolitical tensions, which could disrupt crude supply and impact margins.
🌍 Regulatory Challenges
The transition to the 45Z credit system may create short-term economic pressures on renewable diesel production and overall market dynamics, requiring careful navigation.
We use cookies to analyze site traffic and optimize your site experience.
By accepting, you consent to our use of cookies. Read our Privacy Policy to Learn more.